completed
Decision-Making Dashboard
A management dashboard consolidating network and infrastructure health for faster operational decisions.
A management dashboard consolidating network and infrastructure health for faster operational decisions.
As an IT Expert at Arian Saeed Industrial Groups (ASIGI), I supported virtualization servers, printers, and the broader network — and noticed that leadership was making infrastructure decisions (when to provision more capacity, which sites needed attention) from scattered status emails rather than any single source of truth. This project consolidated that into one dashboard.
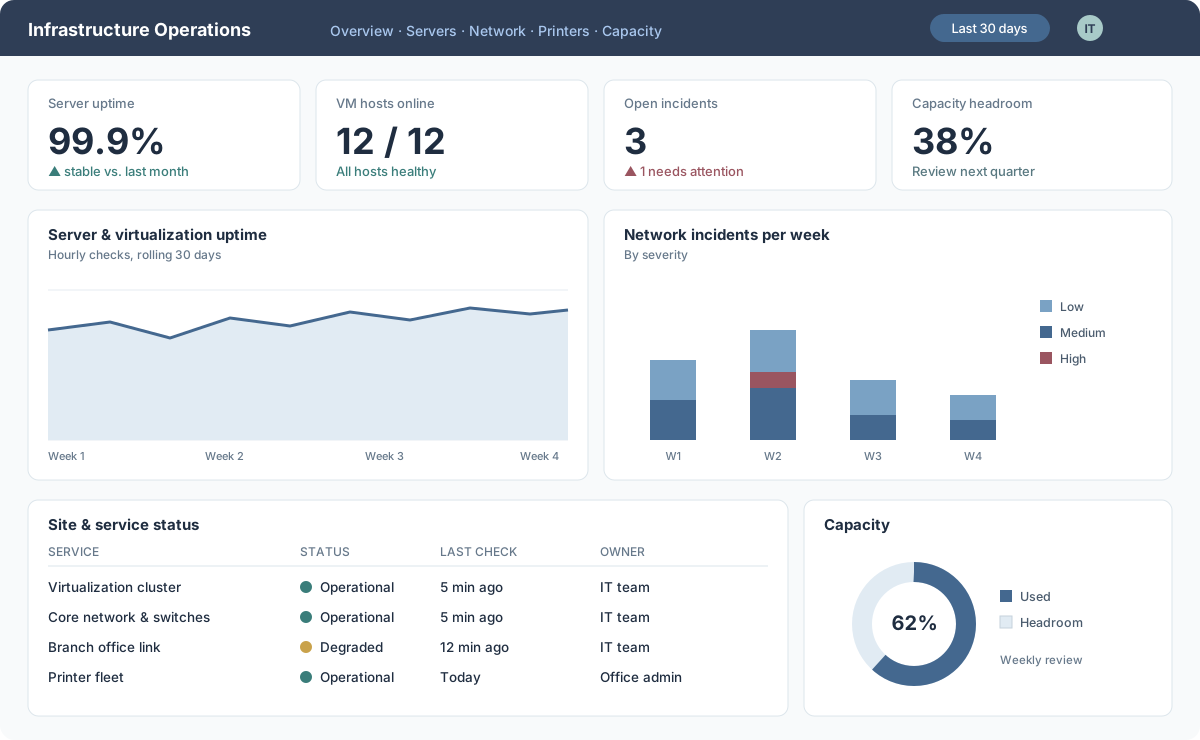
| Metric | Refresh | Audience |
|---|---|---|
| Server & virtualization uptime | Hourly | IT team |
| Printer fleet status | Daily | Office admin |
| Network incident count | Daily | Leadership |
| Capacity headroom | Weekly | Leadership |
Leadership could check current infrastructure status in one place instead of waiting on an email summary, which shortened the lag between an emerging capacity issue and the decision to act on it.